See your Brain as a tree or a graph
HTO Labs shows your Brain in two ways. The Brain tree lays out your folders and notes like an org chart. The Brain graph draws every note and the links between them.
Open the views
Press Views, the eye in the bar on the left. The switch at the top moves between Brain tree and Brain graph. Both views are also on the web.
The Brain tree
The tree starts with your Brain’s first folders as boxes. Each box says how many notes and files it holds. Your workspace’s pages have a box of their own.
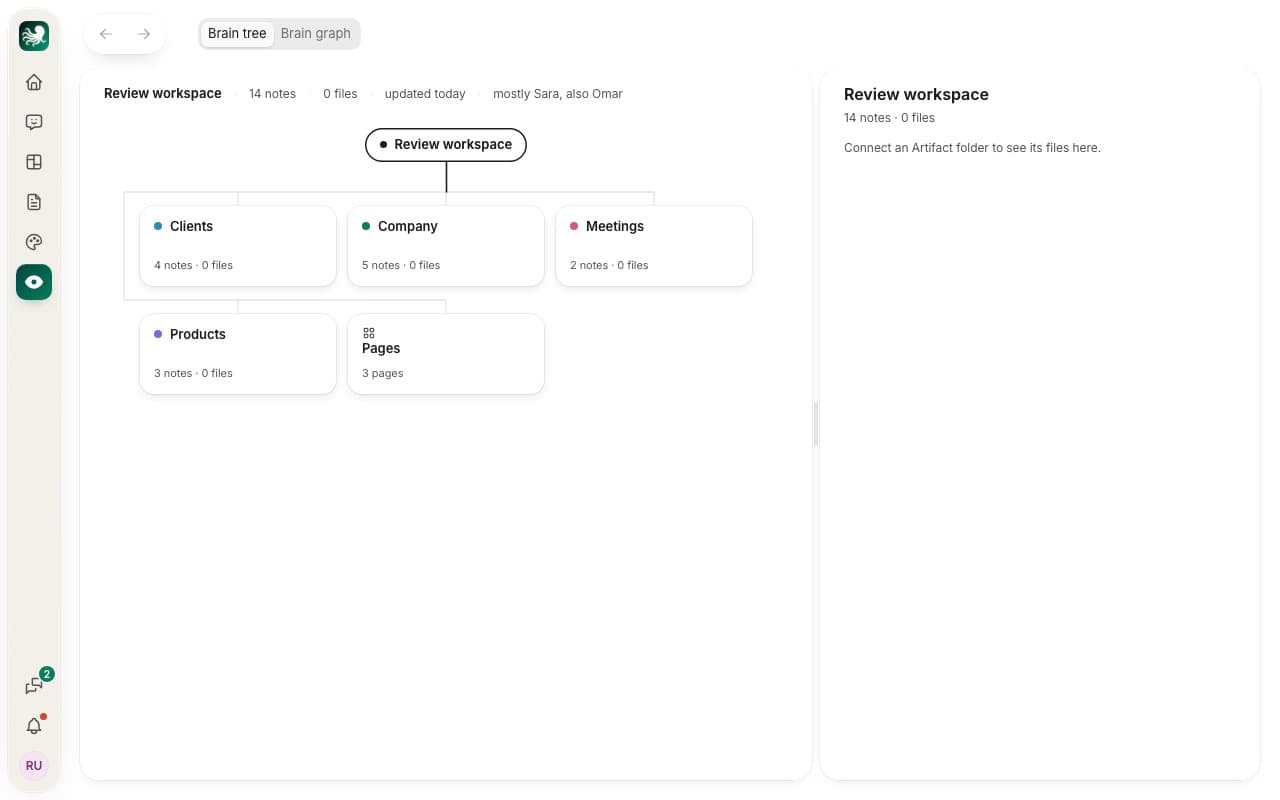
Click a folder to open it. Its folders and notes appear below, A to Z, and the folder’s files show in the bar on the right. Click a note to read it in that bar. In the Mac app you can change the note and save it. On the web you read it.
The Brain graph
In the graph, each note is a dot and each link is a line. Each of your first folders gets an area in a color of its own. Drag a note to move it, and it settles back. Click a note to read it.
The buttons at the top switch between 3D and 2D and open three panels:
- Groups lists each area and its folders, with how many notes they hold. Click one to go to it. Whole Brain shows everything again.
- Filters picks notes by tag, kind, status, who edited them last and when. The notes that fit stand out. With Hide the rest, only they stay. Tags as dots shows each tag as a small ring joined to its notes.
- Controls colors the notes by area or by last edit, and sets the space between notes and between groups.
Still stuck? Write to us, and a person at HTO & Beyond answers.